What does the data say about Jonathan Taylor?
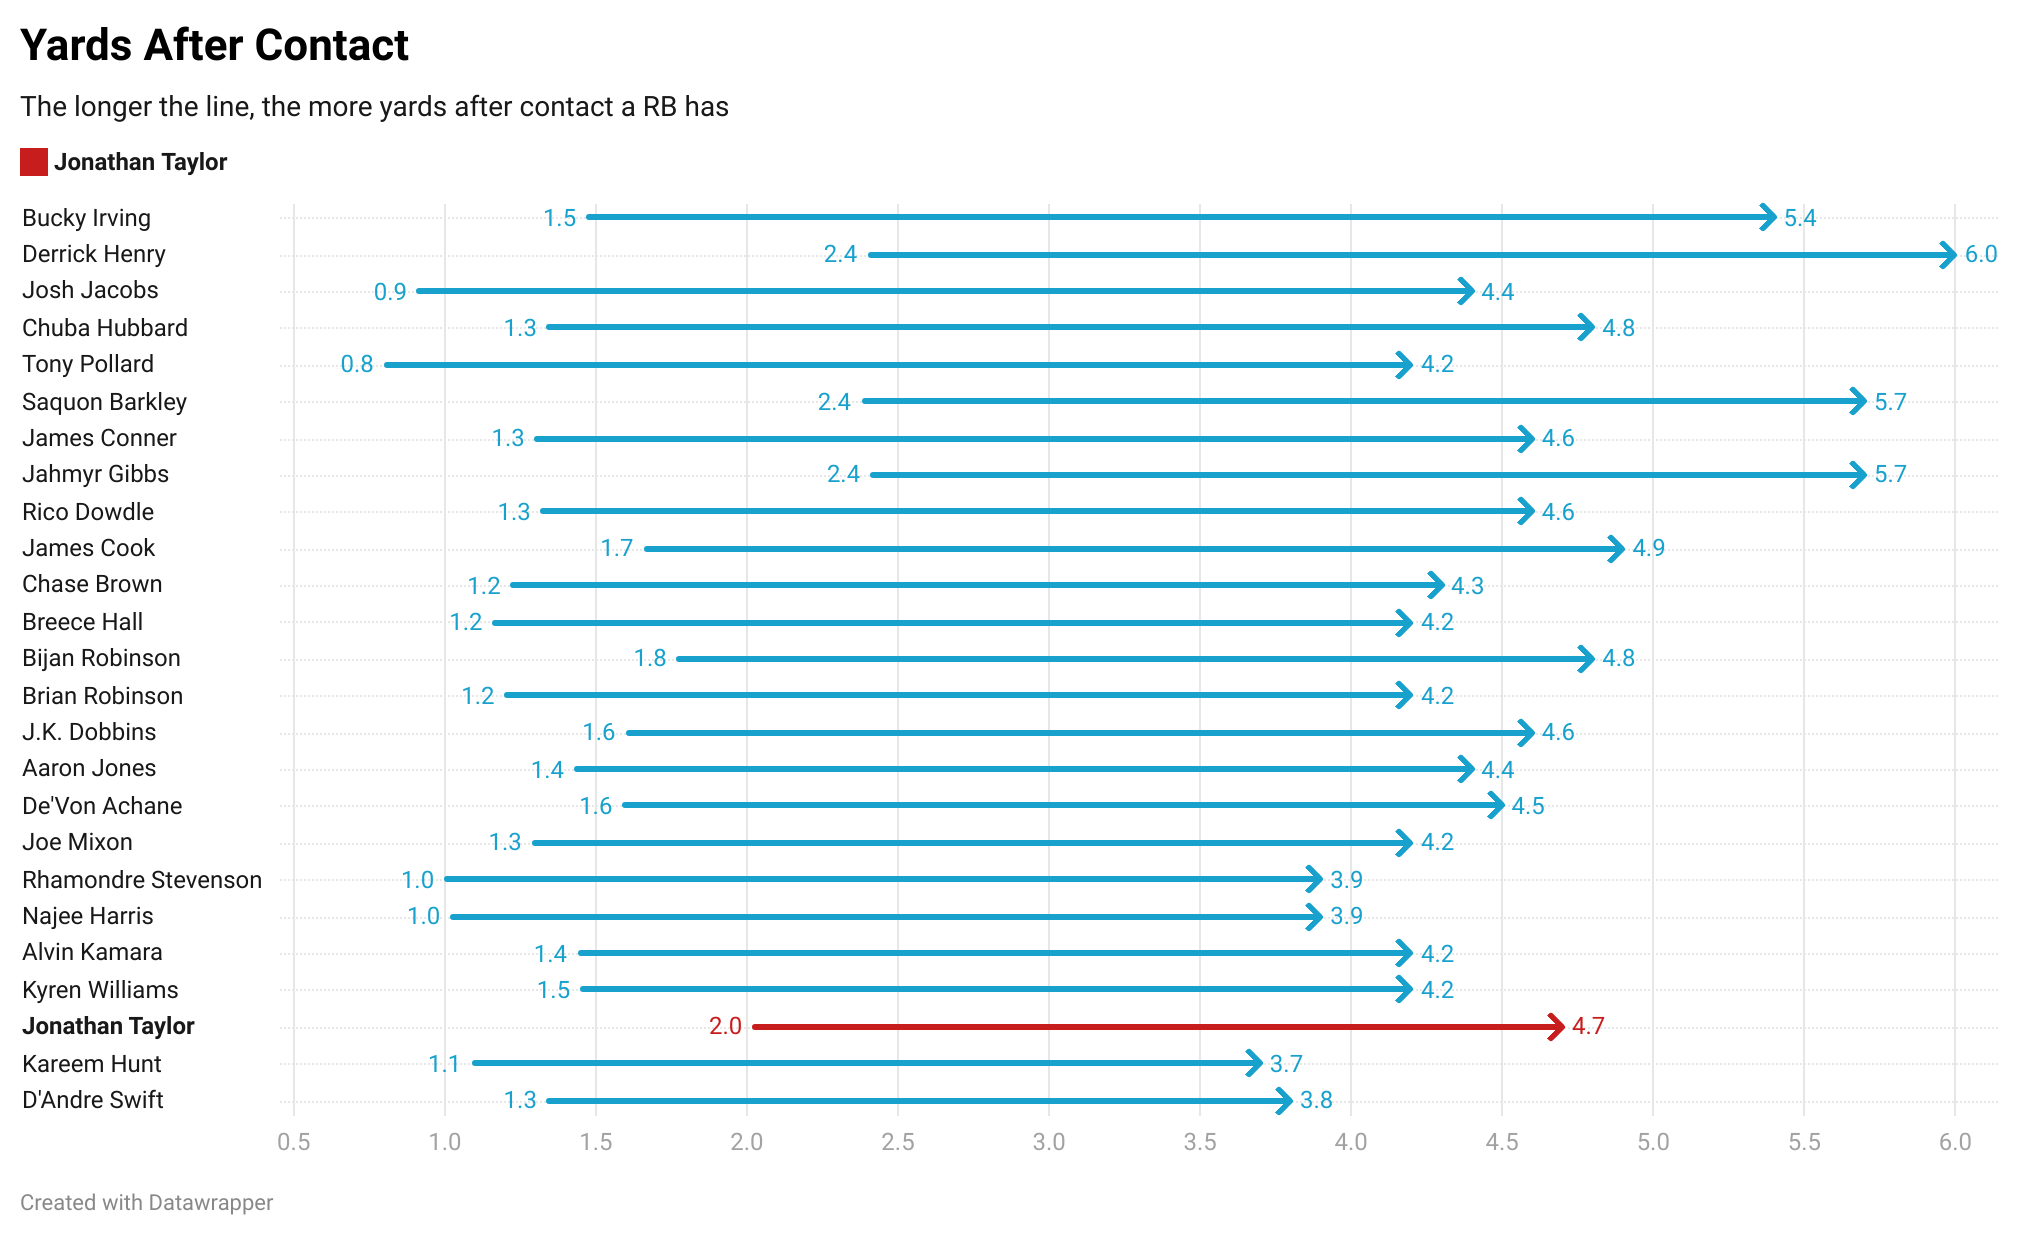
Jonathan Taylor remains one of the NFL’s most productive backs, but some stats paint a mixed picture. For example, a recent chart showed Taylor’s yards after contact (YAC) per carry at ~2.7 – well below leaders like Saquon Barkley (3.3) or Derrick Henry (3.6).
On its face, that low YAC might seem at odds with Taylor’s talent. However, this statistic only tells part of the story. YAC measures how many yards a runner gains after first contact with a defender, and is widely used as a stat that neutralizes the playing field amongst RBs. For example, a RB who has a high yards per attempt (YPA), but a low YAC might be reaping the benefits of exemplary run blocking.
A Colts analysts noted that in the four games at the end of 2024, “a little over half” of Taylor’s rushing yards came before contact. As Taylor himself quipped, “Those guys up front, they do a lot of the heavy lifting; I’m just passing by. I’m like a ship in the night.”
Nonetheless, a low YAC doesn’t instantly equate to Taylor being ineffective – it simply reflects how he gains yards. He rarely powers through tackles (so he doesn’t accumulate big “after-contact” gains), but he often busts into the second level quickly.
Explosiveness and Big Plays
Another standard metric is “explosive runs” – typically the count or rate of carries gaining 10+ yards. Taylor had 31 runs of 10+ yards in 2024. This was good but not elite: Saquon Barkley led the league with 49 such runs, Henry had 47, and Detroit’s Jahmyr Gibbs had 46. Taylor’s explosive-run rate (~8.6%) was noticeably lower than Barkley’s or Henry’s (~12–13%). Players like Jahmyr Gibbs had a rate of 16%+. In plain terms, Taylor broke off a long gain on roughly 1-in-12 carries, whereas the game’s top backs did so closer to 1-in-8.
However, explosiveness isn’t everything. Taylor still ranked highly in overall yards per attempt (YPA) – 4.7 in 2024, 11th among running backs. He also racked up huge yardage totals (fourth-most in the NFL) despite missing games. Explosive runs are flashy, but consistency matters too. Taylor’s workmanlike style has often produced steady gains, even if fewer highlight-reel runs.
Broken Tackles and Missed-Defender Metrics
Metrics that count missed tackles forced or broken tackles highlight a runner’s contact balance. By these measures, Taylor ranks lower. Pro Football Reference noted Taylor was only 21st among RBs in broken tackles. PFF reported he forced just 36 missed tackles in 2024 (40th of 43 qualifying backs) – many fewer than bruisers like Henry (89). In short, Taylor isn’t dragging defenders for extra yardage. The PFF metrics confirm this: Taylor’s forced missed tackles and broken-tackle counts are near the bottom among starting backs.
Success Rate and Efficiency (EPA)
More holistic measures of a running back’s value include success rate and expected points added (EPA). Success rate (as tracked by Next Gen Stats) is the share of carries with positive EPA (ex: meaningful gain toward the first down or scoring). Taylor’s success rate in 2024 was only about 36.0% – well below the 44–48% typical for a top back. In fact, Taylor ranked outside the top 20 in success rate, meaning more than 60% of his runs were neutral or negative in impact. This suggests many of his carries were routine or short, rather than consistently getting “positive” yardage.
Similarly, Taylor’s EPA per rush was slightly negative (~–0.07). Negative EPA doesn’t mean he’s bad – it partly reflects heavy usage and game context – but it does mean his carries on average didn’t increase Indianapolis’ win expectancy. By comparison, Derrick Henry’s EPA per rush was +0.12 (Henry’s runs added value on average). In other words, NFL tracking data rated Henry’s runs (with lots of broken tackles and extra yardage) as adding more value than Taylor’s, even though Taylor also had high volume.
Taylor’s yards over expected (NYFOE/Next Gen) metrics are similarly middle-of-the-pack. He finished roughly in the teens in per-attempt yards over expected (0.6). He did not stand out as outperforming the statistical expectation by the kind of margin that some backs like Saquon (1.6) or Henry (1.8) did this past year. In summary, on success rate and EPA measures Taylor looks solid but not spectacular – again reflecting his steady, volume-based game more than a high-impact rushing style.
Receiving and Yards per Route Run
Taylor’s role is primarily as a runner, but he also catches passes. In 2024 he ran 202 routes (about 46% of his pass snaps). His receiving production was modest: he caught 18 passes for 136 yards. Crucially, his yards per route run (YPRR) was only 0.67, which is very low for any skill player. He wasn’t a big-play threat in the passing game, and his catch rate (58%) was unremarkable.
For context, a receiving-focused back like Alvin Kamara or Christian McCaffrey often gets 2–3+ yards per route. Taylor’s usage was limited (just 8% target share), and the Colts used him sparingly as a receiver. So, while not an advanced rushing stat, the YPRR stat reinforces that Taylor’s value is almost entirely on the ground, further establishing the lack of versatility Taylor possesses.
Putting It All Together
Taylor’s profile across these metrics shows a clear pattern: he hits holes and gains yards early (high yards-to-contact), but doesn’t pile up extra yards dragging tacklers. He racks up volume stats (total yards, carries, TDs) and a solid YPA, but his big-play rate and broken-tackle numbers are average or below average.
For example, in 2024, Taylor averaged 2.02 yards before contact, meaning on average he was already 2 yards downfield before defenders touched him. Many elite backs do less in terms of YBC and make up the difference after the first hit. Taylor is the opposite: he gashes defenses early. It’s therefore unsurprising that an official chart shows his YAC line as short – he simply relies on blocks and angles more than sheer power. In a team with strong blocking, this style maximizes efficiency.
Still, his collective body of statistical work is severely lacking. If I were to exclude film from his evaluation, I would come away thinking that I was looking at a one-dimensional RB with low individual skills who was bailed out by good OL play and a high amount of volume (think Najee Harris).
This comes across as incredibly harsh for anyone who is a Colts fan. It's even more insulting if, like myself, you are a Jonathan Taylor fan. I personally believe he's the most impactful offensive player that the Colts have, while simultaneously being the engine that drives the offense. That's why this analytical profile is so dumbfounding. How could a player, who looks incredible on film, have this statistical output? Some contextual cues could serve as explanations, but none are super robust. Playing with Flacco was a limiting factor. A weak passing game may have caused rivaling teams to become hyperfixated on him. Injuries could have stifled his explosiveness.
All in all, I don't want this to come across as a hit-piece on JT. He's an incredibly talented player. However, the fact of the matter is that the statistics paint a less-than-ideal picture. Stats are not everything, but it may become hard to argue paying $15M a year to an ineffective RB with an extensive injury history and 2100+ carries.